"Reports" subsection in "Analytics"
Last modified:
The “Reports” section helps to quickly evaluate what is happening in the business: how sales are going, which services bring results, how staff work, and which indicators require attention.The subsection gathers in one place all forms of reports and analytics that are available in different sections of DIKIDI.
✅ Here you can quickly view key business indicators without unnecessary navigation through the app.
Why are reports needed?
Reports help make decisions based on data, not just on feelings. With their help, you can:
- track sales dynamics;
- view results for the selected period;
- evaluate staff performance;
- analyze services and other business indicators;
- notice changes in revenue, workload, and sales faster;
- understand which areas are worth developing.
For example, if you see a decrease in sales, you can view the report for the required period and understand what it is connected with.
Where to view "Reports"?
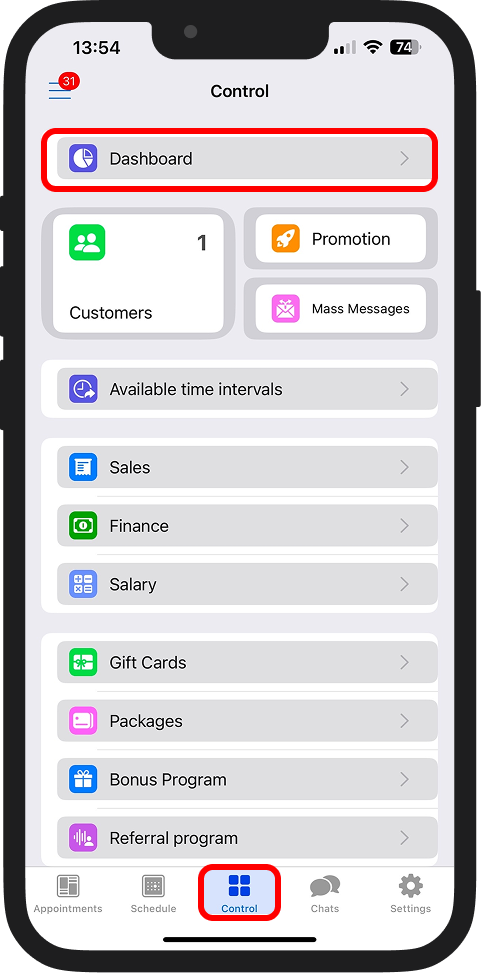
1️⃣ To view a report, go to the "Control" → "Dashboard" → "Reports" section.
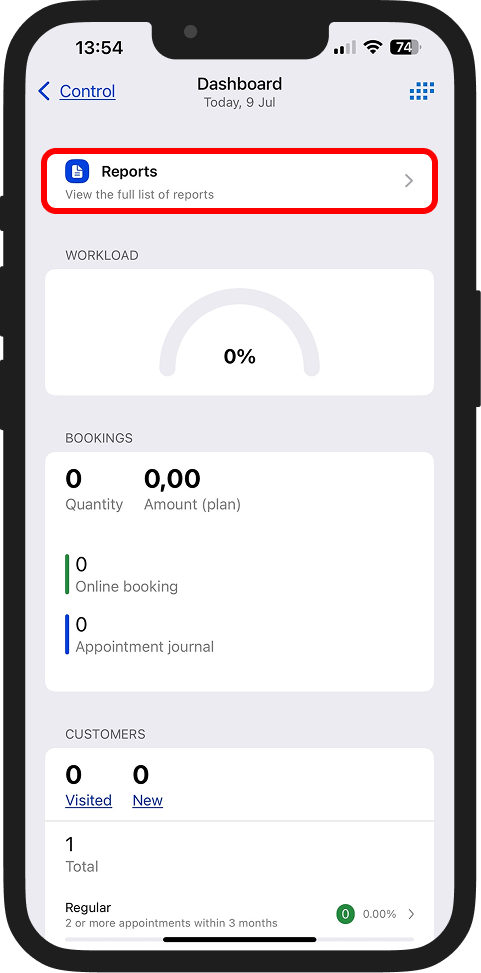
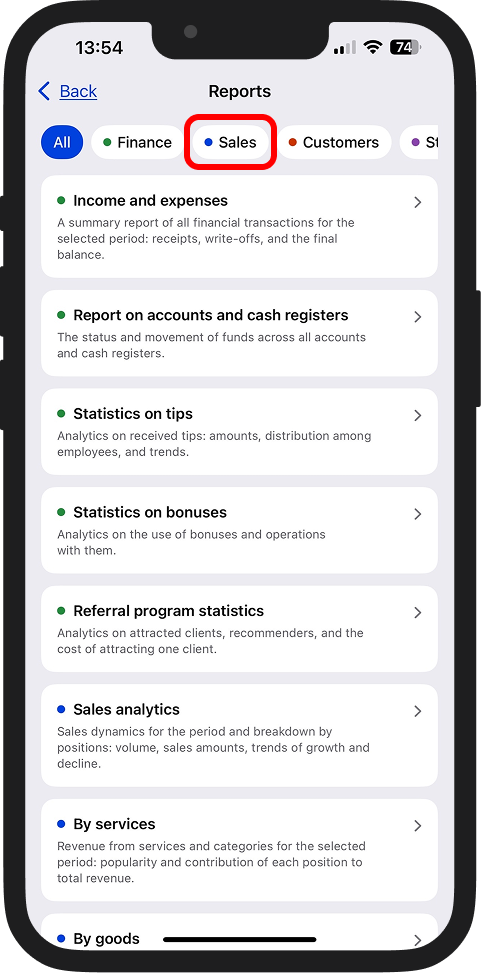
2️⃣ In the top menu, you will be prompted to select a filter. Determine which indicators you want to analyze:
- Finance – data on revenue and other financial indicators.
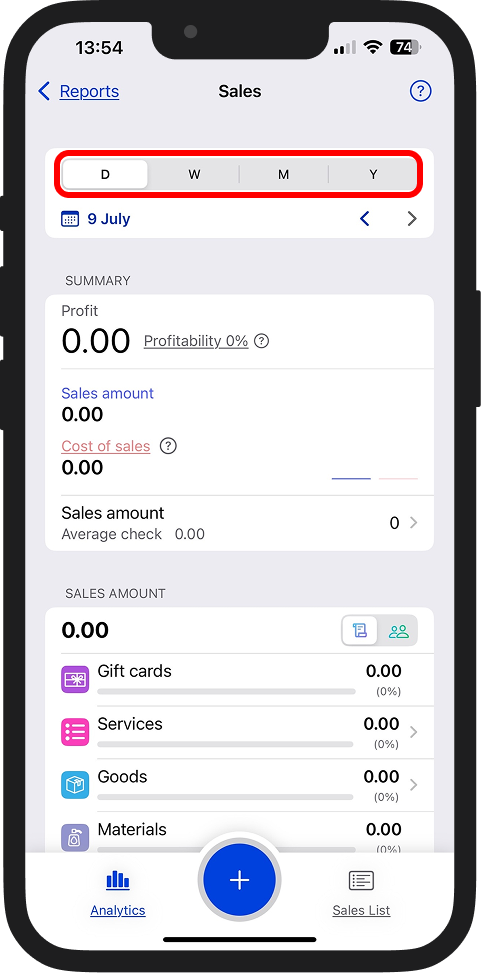
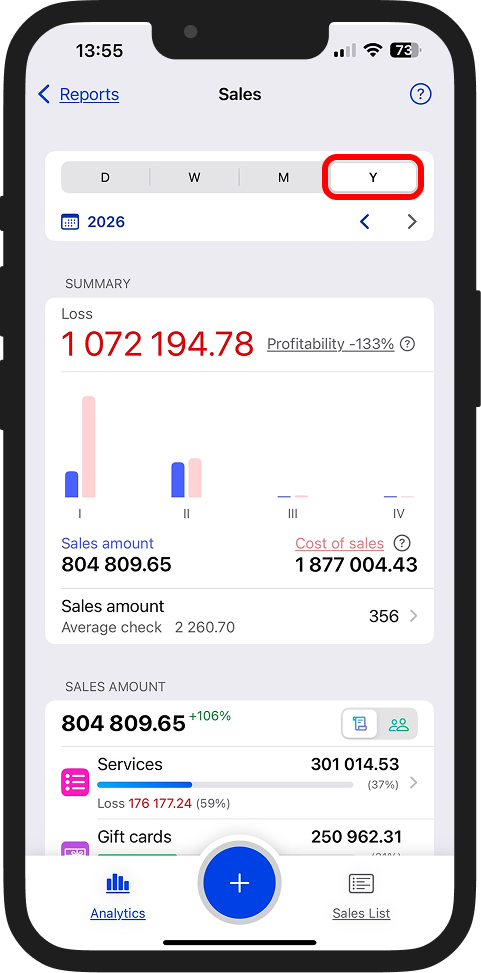
- Sales – analytics on sales of services, products, or gift cards.
- Staff – performance indicators of the team and specialists' salaries.
- Customers – information on the customer base, retention, and lost customers.
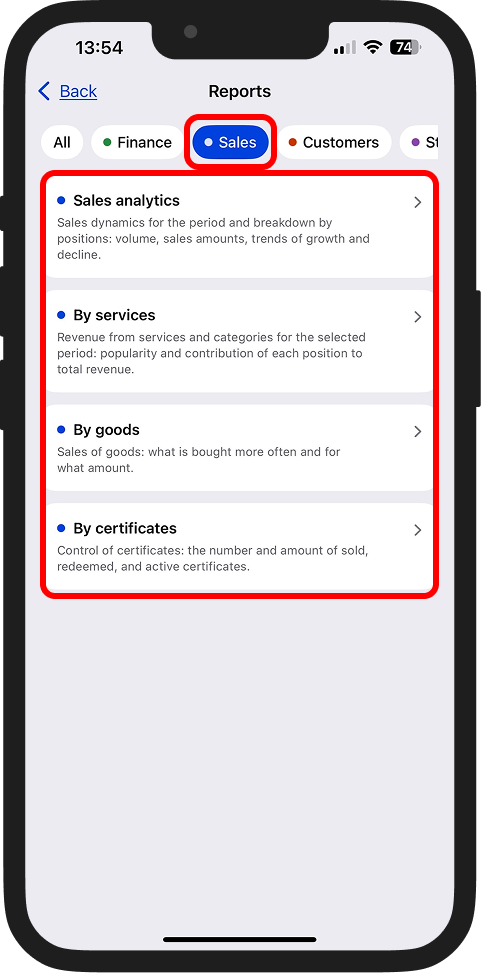
3️⃣ In a separate section, you can view reports by different categories. Select the required period – and DIKIDI will show data that will help evaluate business results and compare them with each other.
Read more:
Sales Analytics in the DIKIDI Business App